QUESTIONS
Question 1
A study took a random sample of students and asked them how many hours the studied and how many hours they played video games on the day before a test. The data showed that students who spent more time studying earned higher test scores than students who spent more time playing video games. Select the correct answer below.
- The study is an observatory study
- The study is an experiment. The controlled factor is student’s test scores.
- The study is an experiment. The controlled factor is the survey.
- The study is an experiment. The controlled factor is time spent playing video games.
Question 2
Collecting credit scores of mortgage applicants are always part of the mortgage approval process for many banks. What is the level of measurement of the data?
Select the correct answer below
- Nominal
- Ordinal
- Interval
- Ratio
Question 3
Matthew wants to estimate the mean height of students attending his college. He records the height of 50 randomly selected students attending the college. What is the sample?
- The mean height of the randomly selected students.
- The Mean height of all students attending the college
- The 50 randomly selected students.
- All the students attending the college
- The heights of the randomly selected students
Question 4
To study the sleeping habits of all band members in his school, Christopher obtains a list of the band members and collects data from every 10th person on the list. Which type of sampling is used?
Select the correct answer below;
- Cluster sampling
- Stratified sampling
- Systematic sampling
- Convenience sampling
Question 5
In order to study the mean blood pressure of people in his town, Richard samples the population by dividing the residents by age and randomly selecting a proportionate number of residents from each age group. Which type of sampling is used?
Select the correct answer below.
- Convenience sampling
- Cluster sampling
- Stratified sampling
- Systematic sampling
Question 6
A small startup company wishes to know how many hours, per week, that its employees spend commuting to and from work. The number of hours for each employee are shown below. Construct a frequency table for grouped data using four classes.
13, 5, 4, 16, 13, 6, 4, 23, 21, 7, 12, 23, 13, 5, 8, 8, 7, 13, 16
Provide your answer below.
| Lower Class Limit | Upper Class Limit | Frequency |
| _________ | __________ | _________ |
| __________ | ___________ | ____________ |
| __________ | ___________ | __________ |
| ___________ | ____________ | _____________ |
Question 7
The frequency table below shows the ages of the students in an astronomy class.
Complete the Relative Frequency column of the table.
Provide your answer below;
| Age | Frequency | Relative Frequency |
| 17 | 17 | |
| 18 | 3 | |
| 19 | 6 | |
| 20 | 8 | |
| 21 | 2 | |
| 22 | 14 |
Question 8
A group of students were surveyed about the number of times they went to a movie theatre last year. Their responses are summarized in the relative frequency table below.
What is the missing relative frequency?
| Number of Movies | Relative Frequency |
| 0 – 1 | 0.08 |
| 2 – 3 | 0.20 |
| 4 – 5 | 0.30 |
| 6 – 7 | _____ |
| 8 – 9 | 0.10 |
| 10 or more | 0.08 |
Question 9
The values and relative frequencies for a set of data are shown below. Compare the cumulative relative frequency table.
Provide your answer below
| Data Value | Relative Frequency | Cumulative Relative Frequency |
| 1 | 0.33 | |
| 2 | 0.06 | |
| 3 | 0.25 | |
| 4 | 0.36 |
Question 10
A data set is summarized in the frequency table below. Using the table, determine the number of values less than or equal to 6.
| Value | Frequency |
| 2 | 3 |
| 3 | 4 |
| 4 | 6 |
| 5 | 3 |
| 6 | 2 |
| 7 | 3 |
| 8 | 4 |
| 9 | 5 |
| 10 | 4 |
| 11 | 4 |
| 12 | 2 |
Provide the answer below;
Question 11
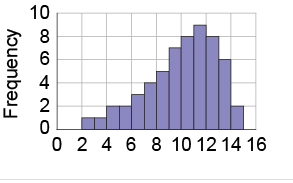
Describe the shape of the given histogram;
Select the correct answer below;

- Uniform
- Unimodal and symmetric
- Unimodal and left-skewed
- Unimodal and right-skewed
- Bimodal
Question 12
A set of data is summarized by the stem and leaf plot below.
| Stem | Leaf |
| 1 | 0 1 2 2 2 3 5 6 7 7 8 8 9 9 |
| 2 | 0 0 1 2 2 2 3 4 5 7 7 7 7 8 8 8 |
| 3 | 0 0 0 0 1 1 1 3 4 4 6 6 7 9 |
| 4 | 0 0 0 0 1 1 1 2 2 2 3 6 6 8 8 9 |
Provide your answer below;
The value 11 appears _____ time(s) in the data set. The value 24 appears ________ time(s) in the data set. The value 43 appears ______ times in the data set. The value 49 appears ______ time(s) in the data set.
Question 13
Find the median for the following set of data;
53, 46, 45, 44, 38, 32, 47, 43, 36
Provide your answer below;
Median =
Answer = 44
Question 14
The following is a data set of the average weekly number of cups of coffee consumed by employees in an office. Find the mean and median and determine if the mean or median is the better measure of central tendency.
1, 0, 3, 7, 0, 1, 27, 1, 5, 7, 3, 1, 2, 9, 8
Select the correct answer below.
- Mean = 3, Median = 3. The mean is the better measure of central tendency.
- Mean = 3, Median = 5. The median is the better measure of central tendency.
- Mean = 5, Median = 3. The mean is the better measure of central tendency.
- Mean = 5, Median = 3. The media is the better measure of central tendency.
Question 15
If the median of a data set is 5 and the mean is 11, which of the following is most likely?
Select the correct answer below.
- The data are skewed to the left
- The data are skewed to the right
- The data are symmetrical
Question 16
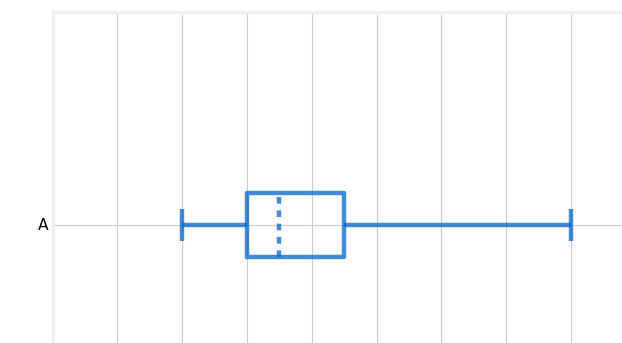
Given the following box-and-whisker plot, decide if the data is skewed or symmetrical.
Select the correct answer below.

- The data are skewed to the left.
- The data are skewed to the right.
- The data are symmetric.
Question 17
The following data values represent the daily amount spent by a family during a 5 day summer vacation. Find the standard deviation of this dataset:
$120, $60, $250, $120, $200
Round the final answer to one decimal place.
Standard deviation =
Question 18
The following data set represents the ages of all six grandchildren in a family.
Find the variance for this data set of ages;
6, 3, 14, 11, 14, 6.
Round the final answer to one decimal place.
Variance =
Question 20
The five-number summary for a set of data is given below
| Min | Q1 | Median | Q3 | Max |
| 40 | 69 | 72 | 79 | 86 |
Using the interquartile range, which of the following are outliers? Select all correct answers.
- 43
- 44
- 48
- 64
- 70
Question 21
The box-and-whisker plot shows the number of pigeons spotted by visitors at the park during the last weekend.

What is the range of data?
Question 22
A deck of cards contains red cards numbered 1, 2, 3 and blue cards numbered 1, 2, 3, 4, 5, 6, 7. Let R be the event of drawing a red card, B to be the event of drawing a blue card, E to be the event of drawing an even-numbered card, and O to be the event of drawing an odd card.
Drawing the blue 6 is an example of which of the following events? Select all correct answers.
- B OR O
- E’
- R AND O
- R OR E
- R’
- R OR O
Question 23
A deck of cards contains red cards numbered 1, 2, blue cards numbered 1, 2, 3, 4 and green cards numbered 1, 2, 3, 4, 5, 6, 7, 8, 9, 10, 11, 12, 13, 14, 15, 16, 17. If a single card is picked at random, what is the probability that the card is blue? Give your answer as a fraction.
Question 24
Which of the pair of events below is dependent?
- Drawing a 2 and drawing a 4 with replacement from a standard deck of cards
- Rolling two 4’s from two rolls of a standard die
- Drawing a heart and drawing another heart with replacement from a standard deck of cards
- Drawing a face card and then drawing a 3 without replacement from a standard deck of cards.
Question 25
Fill in the following contingency table and find the number of students who both go to the beach AND go to the mountains.
| Students | Go to the mountains | Do not go to the mountains | Total |
| Go to the beach | 36 | ||
| Do not go to the beach | 21 | ||
| Total | 48 | 95 |
ANSWERS
Question 1
A study took a random sample of students and asked them how many hours the studied and how many hours they played video games on the day before a test. The data showed that students who spent more time studying earned higher test scores than students who spent more time playing video games. Select the correct answer below.
- The study is an observatory study
- The study is an experiment. The controlled factor is student’s test scores.
- The study is an experiment. The controlled factor is the survey.
- The study is an experiment. The controlled factor is time spent playing video games.
To access all answers, use the purchase button below.
