QUESTIONS
Question 1
| Ages | Number of Students |
| 15 – 18 | 2 |
| 19 – 22 | 4 |
| 23 – 26 | 8 |
| 27 – 30 | 9 |
| 31 – 34 | 6 |
| 35 – 38 | 3 |
Based on the frequency distribution above, is 22.5 a:
- Class midpoint
- Upper class limit
- Class width
- Class boundary
- Lower class limit
Question 2
Data was collected for 262 randomly selected 10 minute intervals. For each ten-minute interval, the number of people entering the atrium of a large mall were recorded. The data is summarized in the table below.
| Number of Guests | Frequency |
| 200 – 204 | 31 |
| 205 -209 | 74 |
| 210 – 214 | 38 |
| 215 – 219 | 31 |
| 220 – 224 | 88 |
What is the class width for this GTDT?
Class width =
Question 3
Here is a data set that has a nearly normal distribution.
| Data | Data | Data | Data |
| 57.84 | 51.97 | 39.51 | 44.7 |
| 41.55 | 37.73 | 68.84 | 61.61 |
| 48.25 | 73.63 | 37.52 | 62.53 |
| 57.68 | 56.08 | 54.7 | 50.72 |
| 50.83 | 44.81 | 58.13 | 59.02 |
| 44.44 | 65.56 | 42.92 | 51.2 |
| 48.84 | 53.21 | 45.72 | 48.06 |
| 60.63 | 42.98 | 57.59 | 45.89 |
| 42.54 | 44.14 | 36.24 | 60 |
| 30.85 | 57.93 | 36.39 | 65 |
In building a GFDT for this data set, you need to know how many values are in the class from 60 to 65. You decided that each class will include the lower class limit, but not the upper class limit. So, how many values are there in the interval [60,65)?
Frequency =
Question 4
Data was collected for 300 fish from the North Atlantic. The length of the fish (in mm) is summarized in the GFDT below.
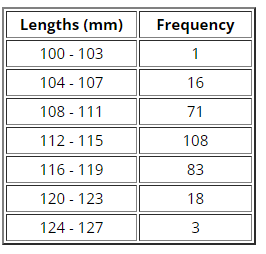
What is the class midpoint for the first class?
Class midpoint =
Question 5
Data was collected for 300 fish from the North Atlantic. The length of the fish (in mm) is summarized in the GFDT below.
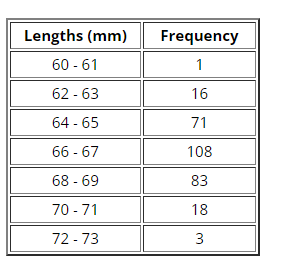
What is the class boundary between the fourth and fifth classes?
Class boundary =
Question 6
Data was collected for 300 fish from the North Atlantic. The length of the fish (in mm) is summarized in the GFDT below.
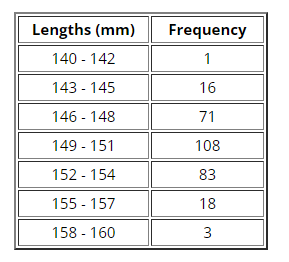
What is the lower class boundary for the first class?
Class boundary =
Question 7
Here is a data set:
| 15 | 69 | 36 | 72 |
| 134 | 136 | 83 | 207 |
| 72 | 43 | 95 | 205 |
| 88 | 109 | 101 | 66 |
| 162 | 142 | 247 | 133 |
| 84 | 80 | 187 | 137 |
| 82 | 56 | 4 | 88 |
The goal is to construct a grouped frequency distribution table (GFDT) for this data set. The GFDT should have 10 classes with a “nice” class width. Each class should contain its lower class limit and each sequential lower class limit should increase by increments of the class width.
This problem is to determine what the class width should be.
What is the range of this data set?
Range =
Using this information, if the goal is to have 10 classes, what is the nicest class width?
optimal class width =
Question 8
Here is a data set:
| 696 | 440 | 655 | 363 |
| 678 | 566 | 469 | 655 |
| 496 | 565 | 473 | 389 |
| 488 | 654 | 363 | 462 |
| 574 | 615 | 560 | 470 |
| 572 | 528 | 441 | 847 |
| 463 | 408 | 501 | 366 |
The goal is to construct a grouped frequency distribution table (GFDT) for this data set. The GFDT should have 10 classes with a “nice” class width. Each class should contain its lower class limit and each sequential lower class limit should increase by increments of the class width. It has been determined that the ideal class width would be 50.
This problem is to determine what the first lower class limit should be.
What is the minimum of this data set?
Min =
What is the minimum divided by the class width?
minimum ÷ class width =
This number rounds down to what integer =
Using this value, if the goal is to have a lower class limits that are multiples of the class width, what should be the first lower class limit?
1st lower class limit =
Question 9
| 2540 | 2680 | 2880 | 4120 |
| 3480 | 3050 | 3740 | 3060 |
| 2950 | 3370 | 3020 | 3160 |
| 3290 | 3000 | 3560 | 3590 |
| 3330 | 4270 | 2540 | 3620 |
| 4710 | 3170 | 3800 | 2820 |
| 2270 | 3610 | 3070 | 4300 |
Construct a grouped frequency distribution table (GFDT) for this data set. You want 10 classes with a “nice” class width. Your classes should be labeled using interval notation. Each class should contain its lower class limit and each sequential lower class limit should increase by increments of the class width. In that the data appears to be discrete, use a closed-interval to label each class.
| Data Range | Frequency |
| 2250, 2490 | |
| 2500,2740 | |
| 2750,2990 | |
| 3000,3240 | |
| 3250,3490 | |
| 3500, 3740 | |
| 3750,3990 | |
| 4000,4240 | |
| 4250,4490 | |
| 4500,4740 |
Question 10
The following data represents the age of 30 lottery winners.
| 20 | 26 | 26 | 27 | 34 | 35 |
| 36 | 36 | 37 | 38 | 39 | 40 |
| 43 | 48 | 49 | 49 | 56 | 59 |
| 60 | 62 | 64 | 68 | 70 | 72 |
| 73 | 74 | 74 | 74 | 77 | 87 |
Complete the frequency distribution for the data.
| Age | Frequency |
| 20-29 | |
| 30-39 | |
| 40-49 | |
| 50-59 | |
| 60-69 | |
| 70-79 | |
| 80 -89 |
Question 11
An ungrouped frequency distribution table (FDT) works for which levels of measurements?
- Ratio
- Interval
- Ordinal
- Nominal
Question 12
In SPSS, if a value falls on an upper/lower real limit, then it is always assigned to the lower interval.
- True
- False
Question 13
One indicator that you’ve done your computations correctly for a cumulative (G)FDT is that the _______ category should have a cumulative frequency value equal to the sample size.
Fill in the blank: ________
Question 14
For GFDTs and the relative GFDTs, the points are centered above the class midpoint. For cumulative or relative cumulative GFDTs, the points are drawn above the _______ interval limits.
Fill in the blank: ___________
Question 15
The line graph below shows the number of times Maria drove her car each day of the week.
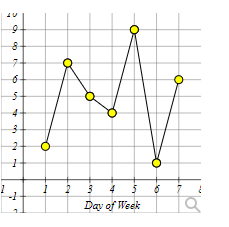
How many times did Maria drive her car on day 4?
Question 16
Kara categorized her spending for this month into four categories: Rent, Food, Fun, and Other. The amounts she spent in each category are pictured here.
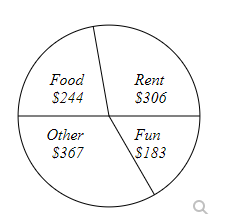
How much total money did Kara spend this month?
Question 17
Kara categorized her spending for this month into four categories: Rent, Food, Fun, and Other. The amounts she spent in each category are pictured here.
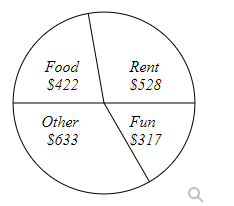
What percent of her total spending did she spend on Rent? Answer to the nearest whole percent.
Question 18
Kiara categorized her spending for this month into four categories: Rent, Food, Fun, and Other. The percents she spent in each category are pictured here.
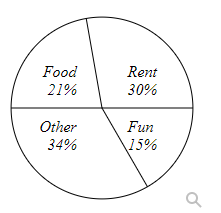
If Kiara spent a total of $2900 this month, how much did she spend on Rent?
Question 19
Elena categorized her spending for this month into four categories: Rent, Food, Fun, and Other. The percents she spent in each category are pictured here.
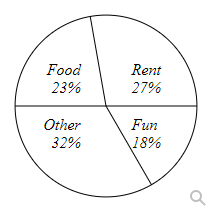
If Elena spent a total of $2400 this month, how much did she spend on Fun?
- $18
- $432
- $456
Question 20
Determine the distribution of the data pictured below
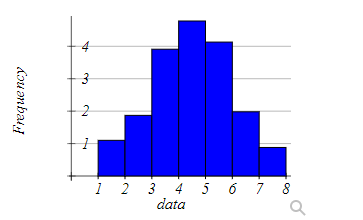
- Uniform
- Bell-shaped
- Skewed-right
- Skewed-right
Question 21
Determine the distribution of the data pictured below.

- Uniform
- Bell-shaped
- Skewed-right
- Skewed-left
Question 22
The line graph below shows the number of times Maria drove her car each day of the week.
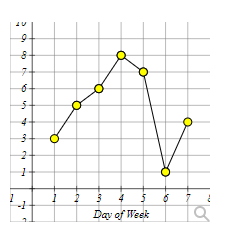
How many times did Maria drive her car on day 4?
Question 23
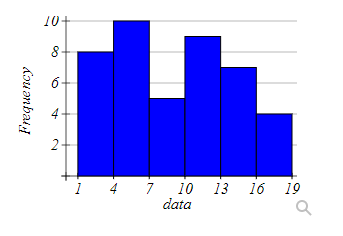
Based on the histogram above, what is the class width?
Class width =
What is the sample size?
Sample size =
Question 24
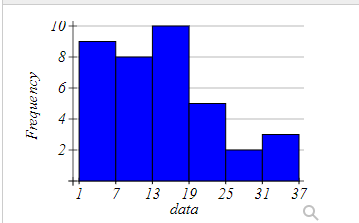
Based on the histogram above, what is the frequency of the class containing the value 26.
Question 25
Given two paired quantitative data sets, choose the best type of graph to represent the data.
- Pareto chart
- Scatter plot
- Ogive
- Histogram
Question 26
Determine the distribution of the data pictured below.
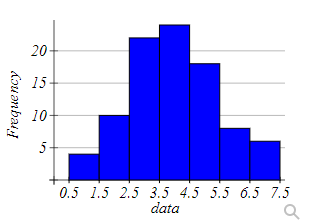
- Uniform
- Bell-shaped
- Skewed-right
- Skewed-left.
Question 27.
The data in the figure below represents the number of stars earned by 140 performers in a talent competition.
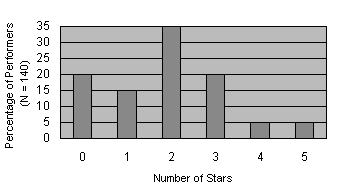
How many performers earned exactly 5 stars? (be careful – compare the question wording to the scale on the graph).
Question 28.
Identify the histogram for the frequency distribution below.
| Bin | Frequency |
| [2,7) | 2 |
| [7,12) | 5 |
| [12,17) | 5 |
| [17,22) | 3 |
| [22,27) | 2 |
Question 29
Barb recorded the color of cars in the town parking lot. She summarized the data in the bar chart below:
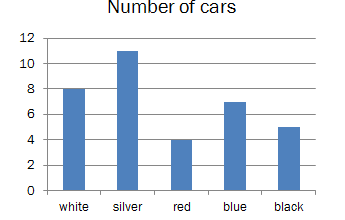
How many of the cars were white?
Question 30
The population of a small village is shown below.
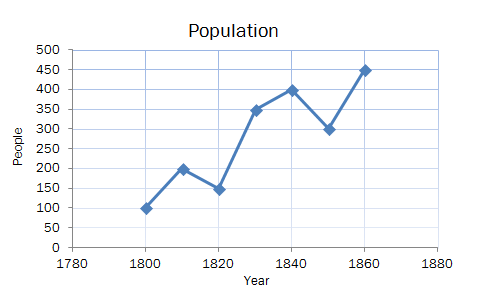
What was the population in 1810?
Question 31
The population of a small village is shown below.
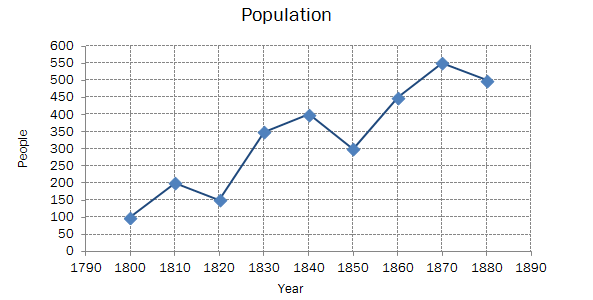
What was the population in 1880?
Question 32
The following data represents the age of 30 lottery winners.
| 21 | 25 | 27 | 28 | 28 | 31 |
| 33 | 37 | 37 | 38 | 38 | 39 |
| 40 | 48 | 49 | 50 | 55 | 62 |
| 64 | 70 | 71 | 72 | 72 | 72 |
| 73 | 74 | 75 | 76 | 76 | 84 |
Complete the frequency distribution for the data.
| Bin | Frequency |
| 20-29 | |
| 30-39 | |
| 40-49 | |
| 50-59 | |
| 60-69 | |
| 70-79 | |
| 80-89 |
Question 33
The inter-quartile range is obtained from subtracting the _________ hinge from the ___________hinge.
Question 34
Data that lie beyond the fences are possible _______
Question 35

Based on the boxplots above, identify the 5 number summary.
Answer: ____, ___ , ___ , ___ , ___ .
Question 36.
Find the minimum for this list of the numbers.
| 88 | 1 |
| 27 | 72 |
| 71 | 6 |
| 95 | 50 |
| 53 | 69 |
| 11 | 94 |
| 49 | 30 |
| 92 |
Minimum =
Question 37
Find the first quartile for the list of numbers
| 22 | 62 |
| 35 | 65 |
| 91 | 98 |
| 59 | 60 |
| 30 | 13 |
| 40 | 75 |
| 14 | 29 |
| 86 |
Quartile =
Question 38
Find the third quartile for this list of numbers
| 35 | 62 |
| 85 | 19 |
| 76 | 55 |
| 36 | 74 |
| 82 | 9 |
| 80 | 67 |
| 18 | 83 |
| 95 |
Quartile 3 =
Question 39
Find the maximum for this list of numbers.
| 36 | 19 |
| 48 | 51 |
| 15 | 39 |
| 66 | 72 |
| 92 | 100 |
| 52 | 3 |
| 54 | 42 |
| 50 |
Maximum =
Question 40

Based on the boxplot above, what is the value for the Q1.
Question 41
Here is a sample data set.
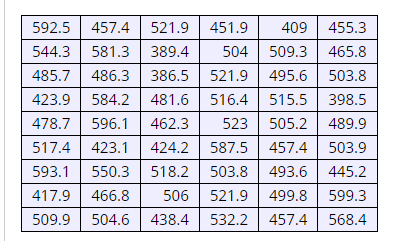
Find the first quartile for this data set.
Q1 =
Find the third quartile for this data set.
Q3 =
Find the interquartile range for this data set.
IQR=
Question 42
Here is a sample data set.
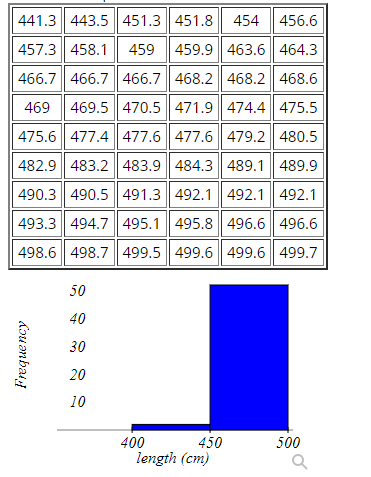
Find the minimum for this data set.
Min =
Find the first quartile for this data set.
Q1 =
Find the median for this data set.
Median =
Find the third quartile for this data set.
Q3 =
Find the maximum for this data set.
Max =
Question 43
Here is a sample data set.
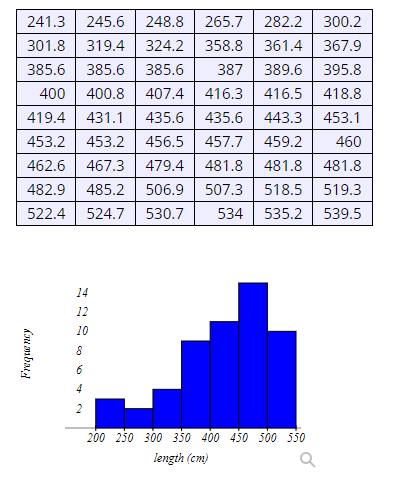
Find the first quartile for this data set.
Q1 =
Find the third quartile for this data set.
Q3 =
Find the interquartile range for this data set.
IQR =
Find the lower fence separating outliers from usual values.
Fence low =
Find the upper fence separating outliers from usual values.
Fence high =
Question 44
Find the first and third quartile for the data shown.
| X |
| 1.1 |
| 2 |
| 6.5 |
| 7.6 |
| 10 |
| 14.7 |
| 16.9 |
| 17.5 |
| 23.7 |
| 27.1 |
Q1=
Q3 =
Question 45
The boxplot below shows salaries for Construction workers and Teachers.
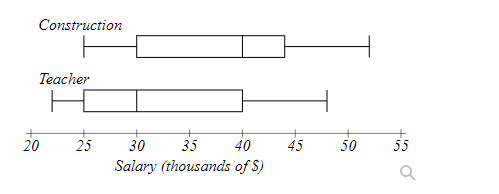
Jennie makes the minimum salary for a construction worker. Markos makes the median salary for a teacher.
Who makes more money?
- Jennie
- Markos
How much more?
Question 46
The boxplot below shows salaries for CPAs and Actuaries in a town.
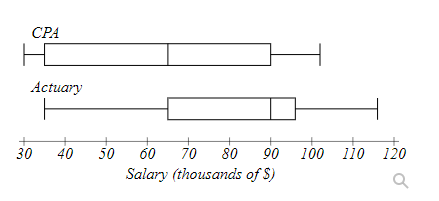
If a person is making the median salary for a CPA, they are making less than ________ of Actuaries.
Question 47
The boxplot below shows salaries for Actuaries and CPAs.
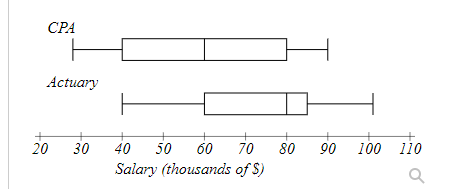
Ben makes the median salary for an Actuary. Bella makes the first quartile salary for a CPA.
Who makes more money?
- Bella
- Ben
How much more?
Question 48.
The boxplot below shows salaries for Construction workers and Receptionists.
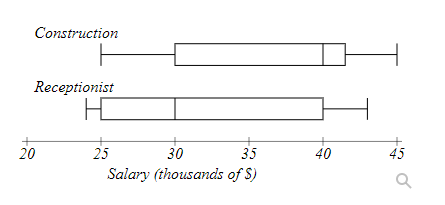
Jennie makes the minimum salary for a construction worker. Markos makes the median salary for a receptionist.
Who makes more money?
- The construction worker
- The receptionist
- They make the same amount.
Question 49
Here is a sample data set (n=48) that is nearly normal (as can be seen in the histogram provided after the data set).
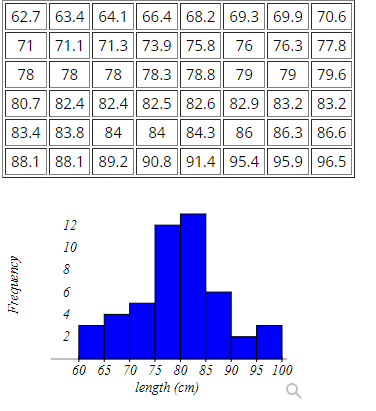
How many mild outliers are in this data set?
Answer =
How many extreme outliers are in this data set?
Answer =
Question 50
Here is a sample data set (n=48) that is nearly normal (as can be seen in the histogram provided after the data set).
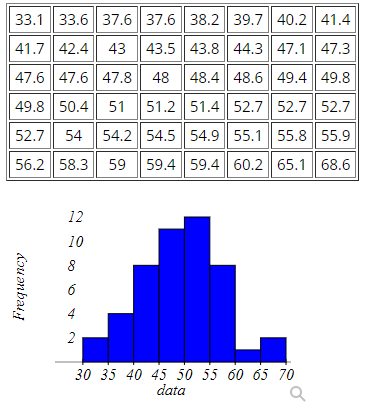
How many outliers are in this data set?
Question 51 Here is a sample data set (n=48) that is nearly normal with two outliers (as can be seen in the histogram provided after the data set).
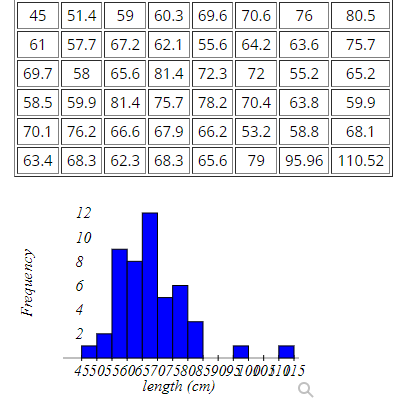
How many mild outliers are in this data set?
How many extreme outliers are in this data set?
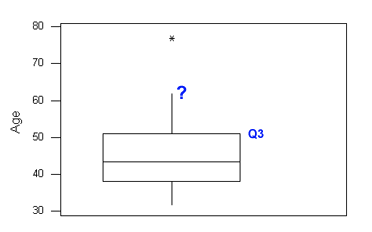
Question 52
Choose the correct label the point on the boxplot represented by the question mark:
Q1
Q3
M
Min
Max
IQR
Range
None of the above
Question 53
Choose the correct label for the point on the boxplot represented by the question mark:
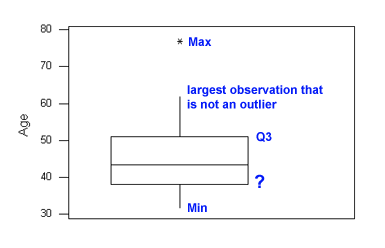
Q1
Q3
M
Min
Max
IQR
Range
None of the above
Question 55
Choose the correct label for the point on the boxplot represented by the question mark:
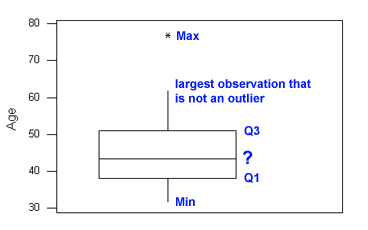
Q1
Q3
M
Min
Max
IQR
Range
None of the above
Question 56
Choose the correct label for the element (in red) on the boxplot represented by the question mark:
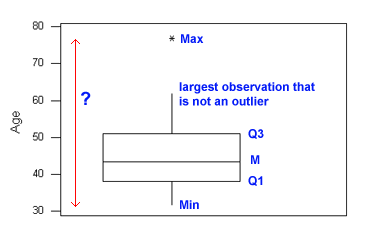
Q1
Q3
M
Min
Max
IQR
Range
None of the above
Question 57
Choose the correct label for the element (in red) on the boxplot represented by the question mark:
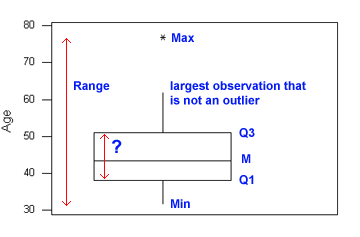
Q1
Q3
M
Min
Max
IQR
Range
None of the above.
ANSWERS
Question 1
| Ages | Number of Students |
| 15 – 18 | 2 |
| 19 – 22 | 4 |
| 23 – 26 | 8 |
| 27 – 30 | 9 |
| 31 – 34 | 6 |
| 35 – 38 | 3 |
Based on the frequency distribution above, is 22.5 a:
- Class midpoint
- Upper class limit
- Class width
- Class boundary
- Lower class limit
To access all answers (100% correct), use the purchase button below.
