QUESTIONS
Question 1
The following frequency table summarizes a set of data. What is the five-number summary?
| Value | Frequency |
| 4 | 1 |
| 5 | 2 |
| 7 | 3 |
| 8 | 1 |
| 9 | 2 |
| 10 | 2 |
| 11 | 1 |
| 12 | 1 |
| 13 | 3 |
| 14 | 3 |
Question 2
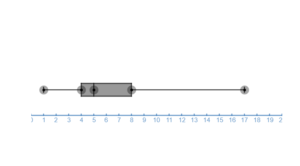
A data set lists the number of hours waiters worked at a restaurant every Friday during the last year. For this data set, the minimum is 1, the median is 5, the third quartile is 8, the interquartile range is 4, and the maximum is 17. Construct a box-and-whisker plot that shows the number of hours worked on a Friday.
Question 3
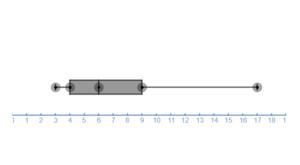
A data set lists the number of hours each student, from a finance class, studied for a midterm. For this data set, the minimum is 3, the median is 6, the third quartile is 9, the interquartile range is 5, and the maximum is 17. Construct a box-and-whisker plot that shows the number of hours studied.
Question 4
Given the following frequency table of data, what is the potential outlier?
| Value | Frequency |
| 5 | 1 |
| 6 | 0 |
| 7 | 0 |
| 8 | 0 |
| 9 | 0 |
| 10 | 0 |
| 11 | 1 |
| 12 | 0 |
| 13 | 1 |
| 14 | 3 |
| 15 | 8 |
| 16 | 7 |
| 17 | 2 |
| 18 | 6 |
| 19 | 1 |
| 20 | 1 |
Question 5
The following table shows 40 different startup companies’ first hour customers, sorted and arranged in rows of 5. What is the 70th percentile of the data?
| 1 | 5 | 6 | 7 | 8 |
| 17 | 18 | 18 | 22 | 29 |
| 31 | 39 | 43 | 46 | 50 |
| 50 | 51 | 55 | 55 | 57 |
| 59 | 62 | 64 | 67 | 71 |
| 72 | 75 | 77 | 77 | 82 |
| 85 | 92 | 92 | 92 | 93 |
Question 6
The five number summary for a set of data is given below.
| Min | Q1 | Median | Q3 | Max |
| 1 | 56 | 80 | 86 | 87 |
Using the interquartile range, which of the following are outliers? Select all correct answers.
Question 7
The five number summary for a set of data is given below.
| Min | Q1 | Median | Q3 | Max |
| 67 | 68 | 80 | 81 | 86 |
What is the interquartile range of the set of data?
Question 8
The following dataset represents the number of people a police officer pulls over for speeding in a month for 56 police officers, sorted and arranged in rows of 5. What is the 2nd quartile of the data?
| 1 | 2 | 5 | 7 | 7 |
| 9 | 10 | 11 | 11 | 14 |
| 15 | 15 | 15 | 18 | 18 |
| 18 | 22 | 22 | 22 | 23 |
| 26 | 27 | 28 | 33 | 34 |
| 34 | 35 | 38 | 38 | 39 |
| 41 | 42 | 45 | 48 | 52 |
| 52 | 54 | 58 | 59 | 61 |
| 65 | 66 | 68 | 70 | 79 |
| 84 | 87 | 87 | 87 | 88 |
| 89 | 91 | 93 | 96 | 97 |
| 98 | ||||
Question 9
The following frequency table summarizes a set of data. What is the five-number summary?
| Value | Frequency |
| 12 | 2 |
| 13 | 1 |
| 14 | 1 |
| 15 | 4 |
| 17 | 5 |
| 18 | 2 |
| 19 | 3 |
| 21 | 1 |
Question 10
The following frequency table summarizes a set of data. What is the five-number summary?
| Value | Frequency |
| 8 | 2 |
| 9 | 1 |
| 10 | 2 |
| 11 | 3 |
| 12 | 4 |
| 13 | 1 |
| 14 | 1 |
| 16 | 1 |
Question 11
The following frequency table summarizes a set of data. What is the five-number summary?
| Value | Frequency |
| 7 | 1 |
| 8 | 1 |
| 9 | 3 |
| 10 | 1 |
| 13 | 3 |
| 15 | 3 |
| 16 | 2 |
| 17 | 1 |
Question 12
The following table shows 40 different hours representing the number of youtube viewers watching an ad, sorted and arranged in rows of 5. What is the 50th percentile of the data?
| 1 | 3 | 3 | 6 | 9 |
| 11 | 14 | 15 | 18 | 21 |
| 23 | 27 | 30 | 30 | 31 |
| 32 | 32 | 43 | 45 | 47 |
| 47 | 52 | 53 | 54 | 56 |
| 58 | 63 | 67 | 68 | 72 |
| 75 | 77 | 80 | 81 | 84 |
| 84 | 86 | 89 | 94 | 97 |
Question 13
The following dataset represents the number of customers a new coffee shop has over the first 60 hours, sorted and arranged in rows of 5. What is the 30th percentile of the data?
| 3 | 3 | 4 | 5 | 6 |
| 6 | 10 | 15 | 18 | 18 |
| 19 | 20 | 22 | 22 | 24 |
| 25 | 29 | 29 | 29 | 22 |
| 33 | 34 | 34 | 39 | 40 |
| 44 | 44 | 44 | 46 | 50 |
| 50 | 51 | 51 | 52 | 55 |
| 55 | 57 | 57 | 58 | 58 |
| 62 | 66 | 70 | 72 | 72 |
| 72 | 75 | 75 | 75 | 78 |
| 79 | 83 | 85 | 85 | 88 |
| 88 | 91 | 97 | 100 | 100 |
Question 14
The five number summary for a set of data is given below.
| Min | Q1 | Median | Q3 | Max |
| 44 | 63 | 70 | 79 | 135 |
Using the interquartile range, which of the following are outliers? Select all correct answers.
Question 15
The five number summary for a set of data is given below.
| Min | Q1 | Median | Q3 | Max |
| 54 | 55 | 64 | 67 | 96 |
What is the interquartile range of the set of data?
Enter just the number as your answer. For example, if you found that the interquartile range was 20, you would enter 20.
Question 16
A data set lists the number of battery charger sales made at a technology store each day for the past few days. For this data set, the minimum is 1, the first quartile is 11, the median is 13, the third quartile is 15, and the maximum is 17. Construct a box-and-whisker plot that shows the number of battery charger sales.
Question 17
A data set lists the number of points scored per game by a baseball team over the 2017 season. For this data set, the minimum is 4, the first quartile is 11, the median is 13, the third quartile is 14, and the maximum is 16. Construct a box-and-whisker plot that shows the number of points scored per game.
ANSWERS:
Question 1
The following frequency table summarizes a set of data. What is the five-number summary?
| Value | Frequency |
| 4 | 1 |
| 5 | 2 |
| 7 | 3 |
| 8 | 1 |
| 9 | 2 |
| 10 | 2 |
| 11 | 1 |
| 12 | 1 |
| 13 | 3 |
| 14 | 3 |
Answer:
| Min | Q1 | Median | Q3 | Max |
| 4 | 7 | 10 | 13 | 14 |
Question 2
A data set lists the number of hours waiters worked at a restaurant every Friday during the last year. For this data set, the minimum is 1, the median is 5, the third quartile is 8, the interquartile range is 4, and the maximum is 17. Construct a box-and-whisker plot that shows the number of hours worked on a Friday.
Answer

Question 3
A data set lists the number of hours each student, from a finance class, studied for a midterm. For this data set, the minimum is 3, the median is 6, the third quartile is 9, the interquartile range is 5, and the maximum is 17. Construct a box-and-whisker plot that shows the number of hours studied.
Answer

Question 4
Given the following frequency table of data, what is the potential outlier?
| Value | Frequency |
| 5 | 1 |
| 6 | 0 |
| 7 | 0 |
| 8 | 0 |
| 9 | 0 |
| 10 | 0 |
| 11 | 1 |
| 12 | 0 |
| 13 | 1 |
| 14 | 3 |
| 15 | 8 |
| 16 | 7 |
| 17 | 2 |
| 18 | 6 |
| 19 | 1 |
| 20 | 1 |
Answer:
5
To access all the answers and explanations on how they were arrived at, click on the button below.
